






Plans & Pricing

Schedule Demo

Schedule Demo

Plans & Pricing

Dropship brands
on the worlds largest marketplaces.

Join the live webinar right now.

Jump in and learn about how you can dropship on marketplaces like Amazon and Walmart selling brand name products under a store (and business) of your own.

Want to learn more about dropshipping on marketplaces?

Play Video

Start selling where your
customers shop everyday.

Start selling where your customers shop everyday.

Amazon®

Start with

Walmart®

Start with

Facebook® Ads

Start with

Instagram® Ads

Start with

TikTok® Ads

Start with

Prime®

Start with

Google® Ads

Start with

Google® Search

Start with

Amazon®

Start with

Walmart®

Start with

Facebook® Ads

Start with

Instagram® Ads

Start with

Prime®

Start with

Google® Ads

Start with

Google® Search

Start with

TikTok®

Start with

Ready to dropship brands that sell millions everyday?

See Plans

Step 1.

Sign-up for a store subscription.

Step 2.

Start driving sales with sales channels.

Step 3.

We handle all of the dropshipping for you.

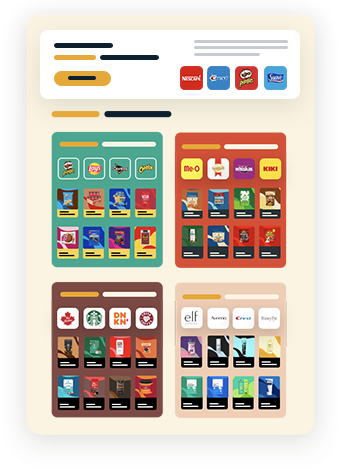
Select your store, all proven and
backed by verified sales estimates.

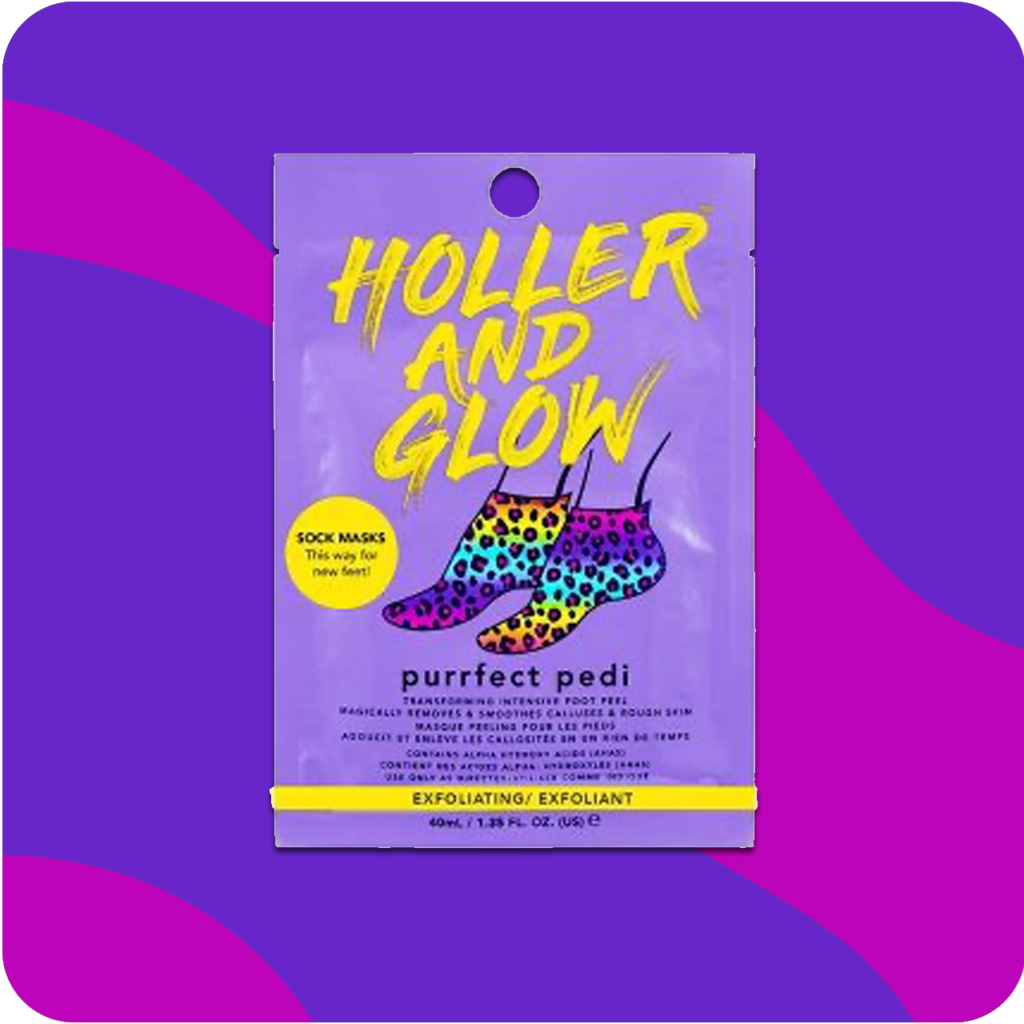
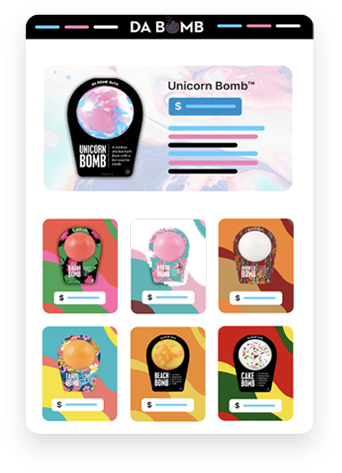
Personal Care Store

Start with

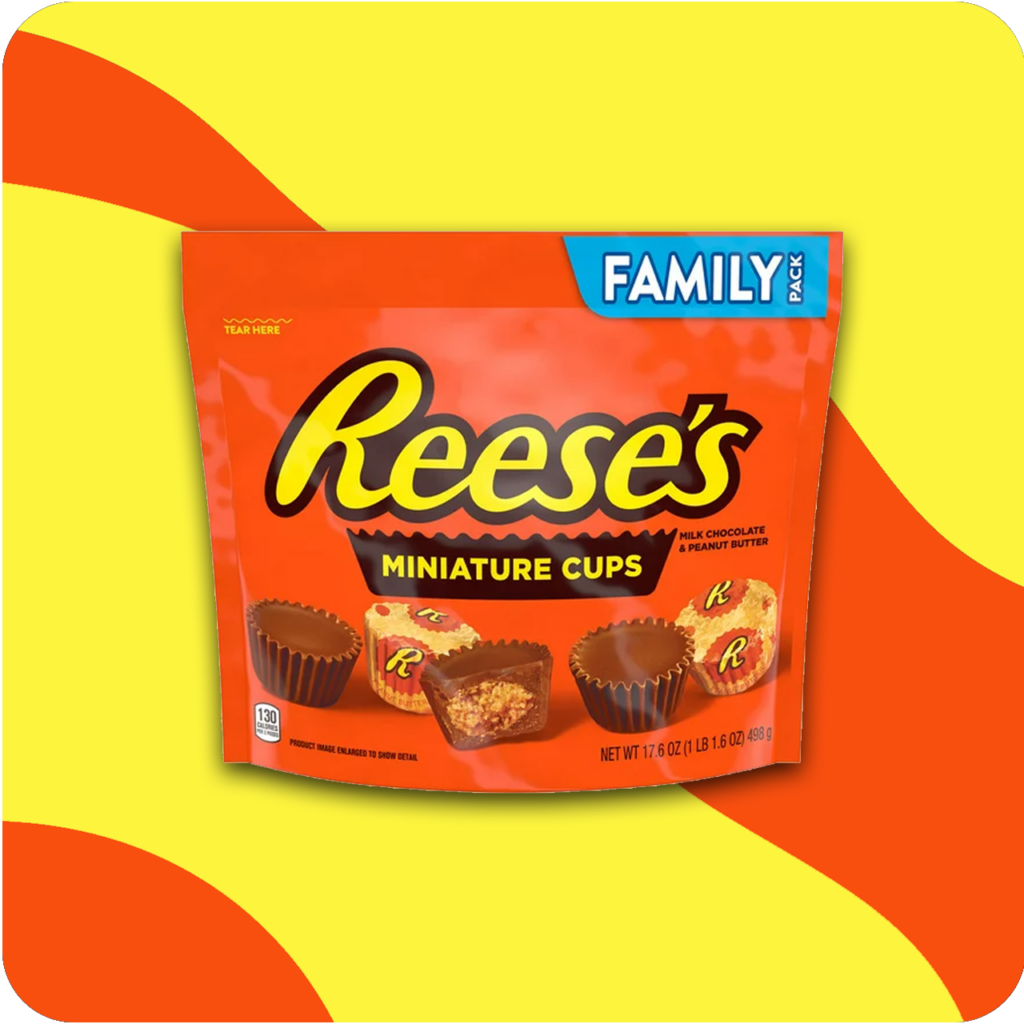
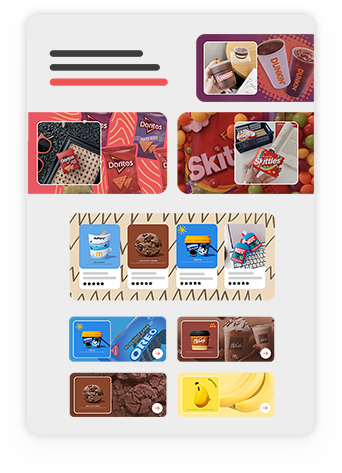
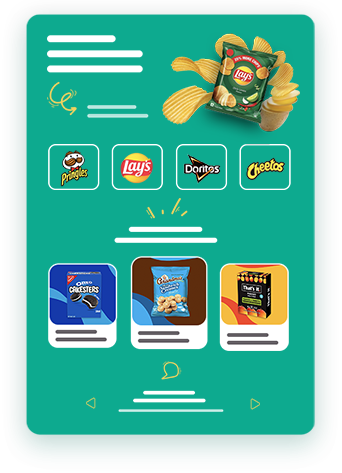
Food & Snacks Store

Start with

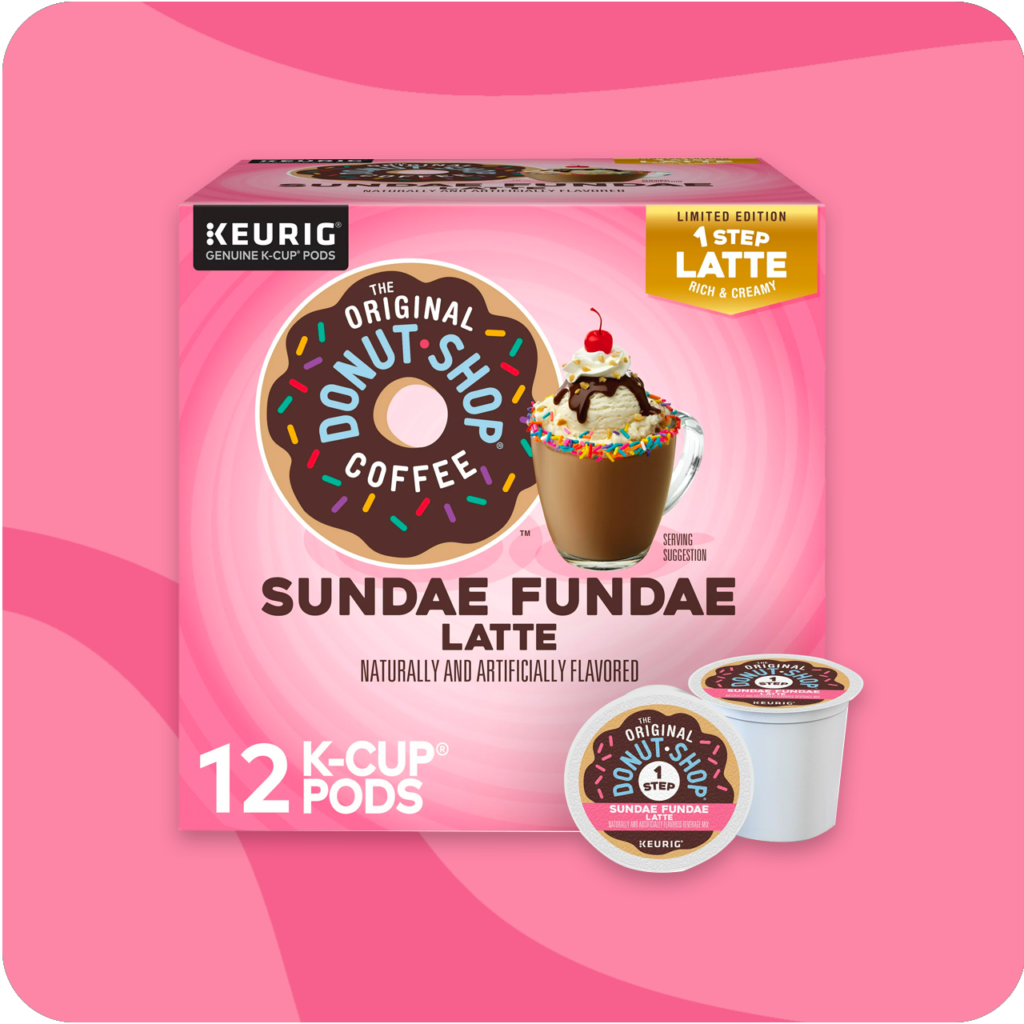
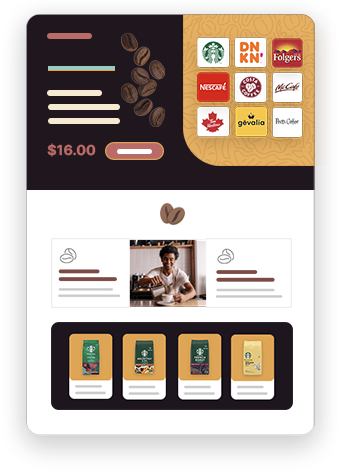
Premium Coffee Store

Start with

Trendy Products Store

Start with

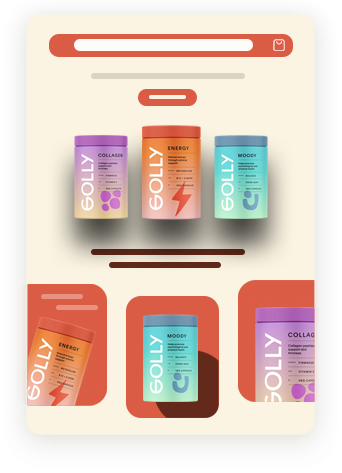
White Label Supplements

Start with

Beauty Store

Start with

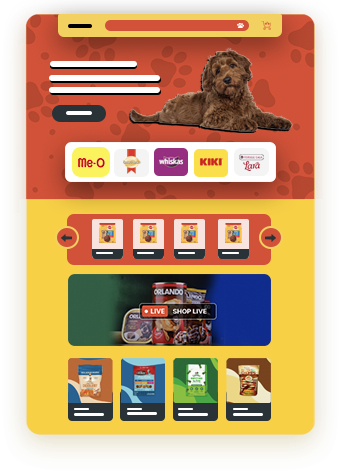
Pet Store

Start with

Children Stock Store

Start with

Newborn Swaddle Store

Start with

General Store

Start with

Personal Care Store

Start with

Snack Store

Start with

Coffee Store

Start with

Trendy Store

Start with

White Label Supplements

Start with

Beauty Store

Start with

Pet Store

Start with

Baby Sock Store

Start with

Baby Swaddle Store

Start with

General Store

Start with

Personal Care Store

Start with

Snack Store

Start with

Beauty Store

Start with

Pet Store

Start with

Coffee Store

Start with

Trendy Store

Start with

Baby Sock Store

Start with

Baby Swaddle Store

Start with

White Label Supplements

Start with

General Store

Start with

No more guessing with dropshipping.
Get predictable results.

Ready to take the guess work out of dropshipping? Our stores (and products) have been proven to work, and are backed by verified third-party sales estimates so you can have peace of mind.

Status Connected
Status
Channel
Type
Cost
Product
Seller Rank
Client

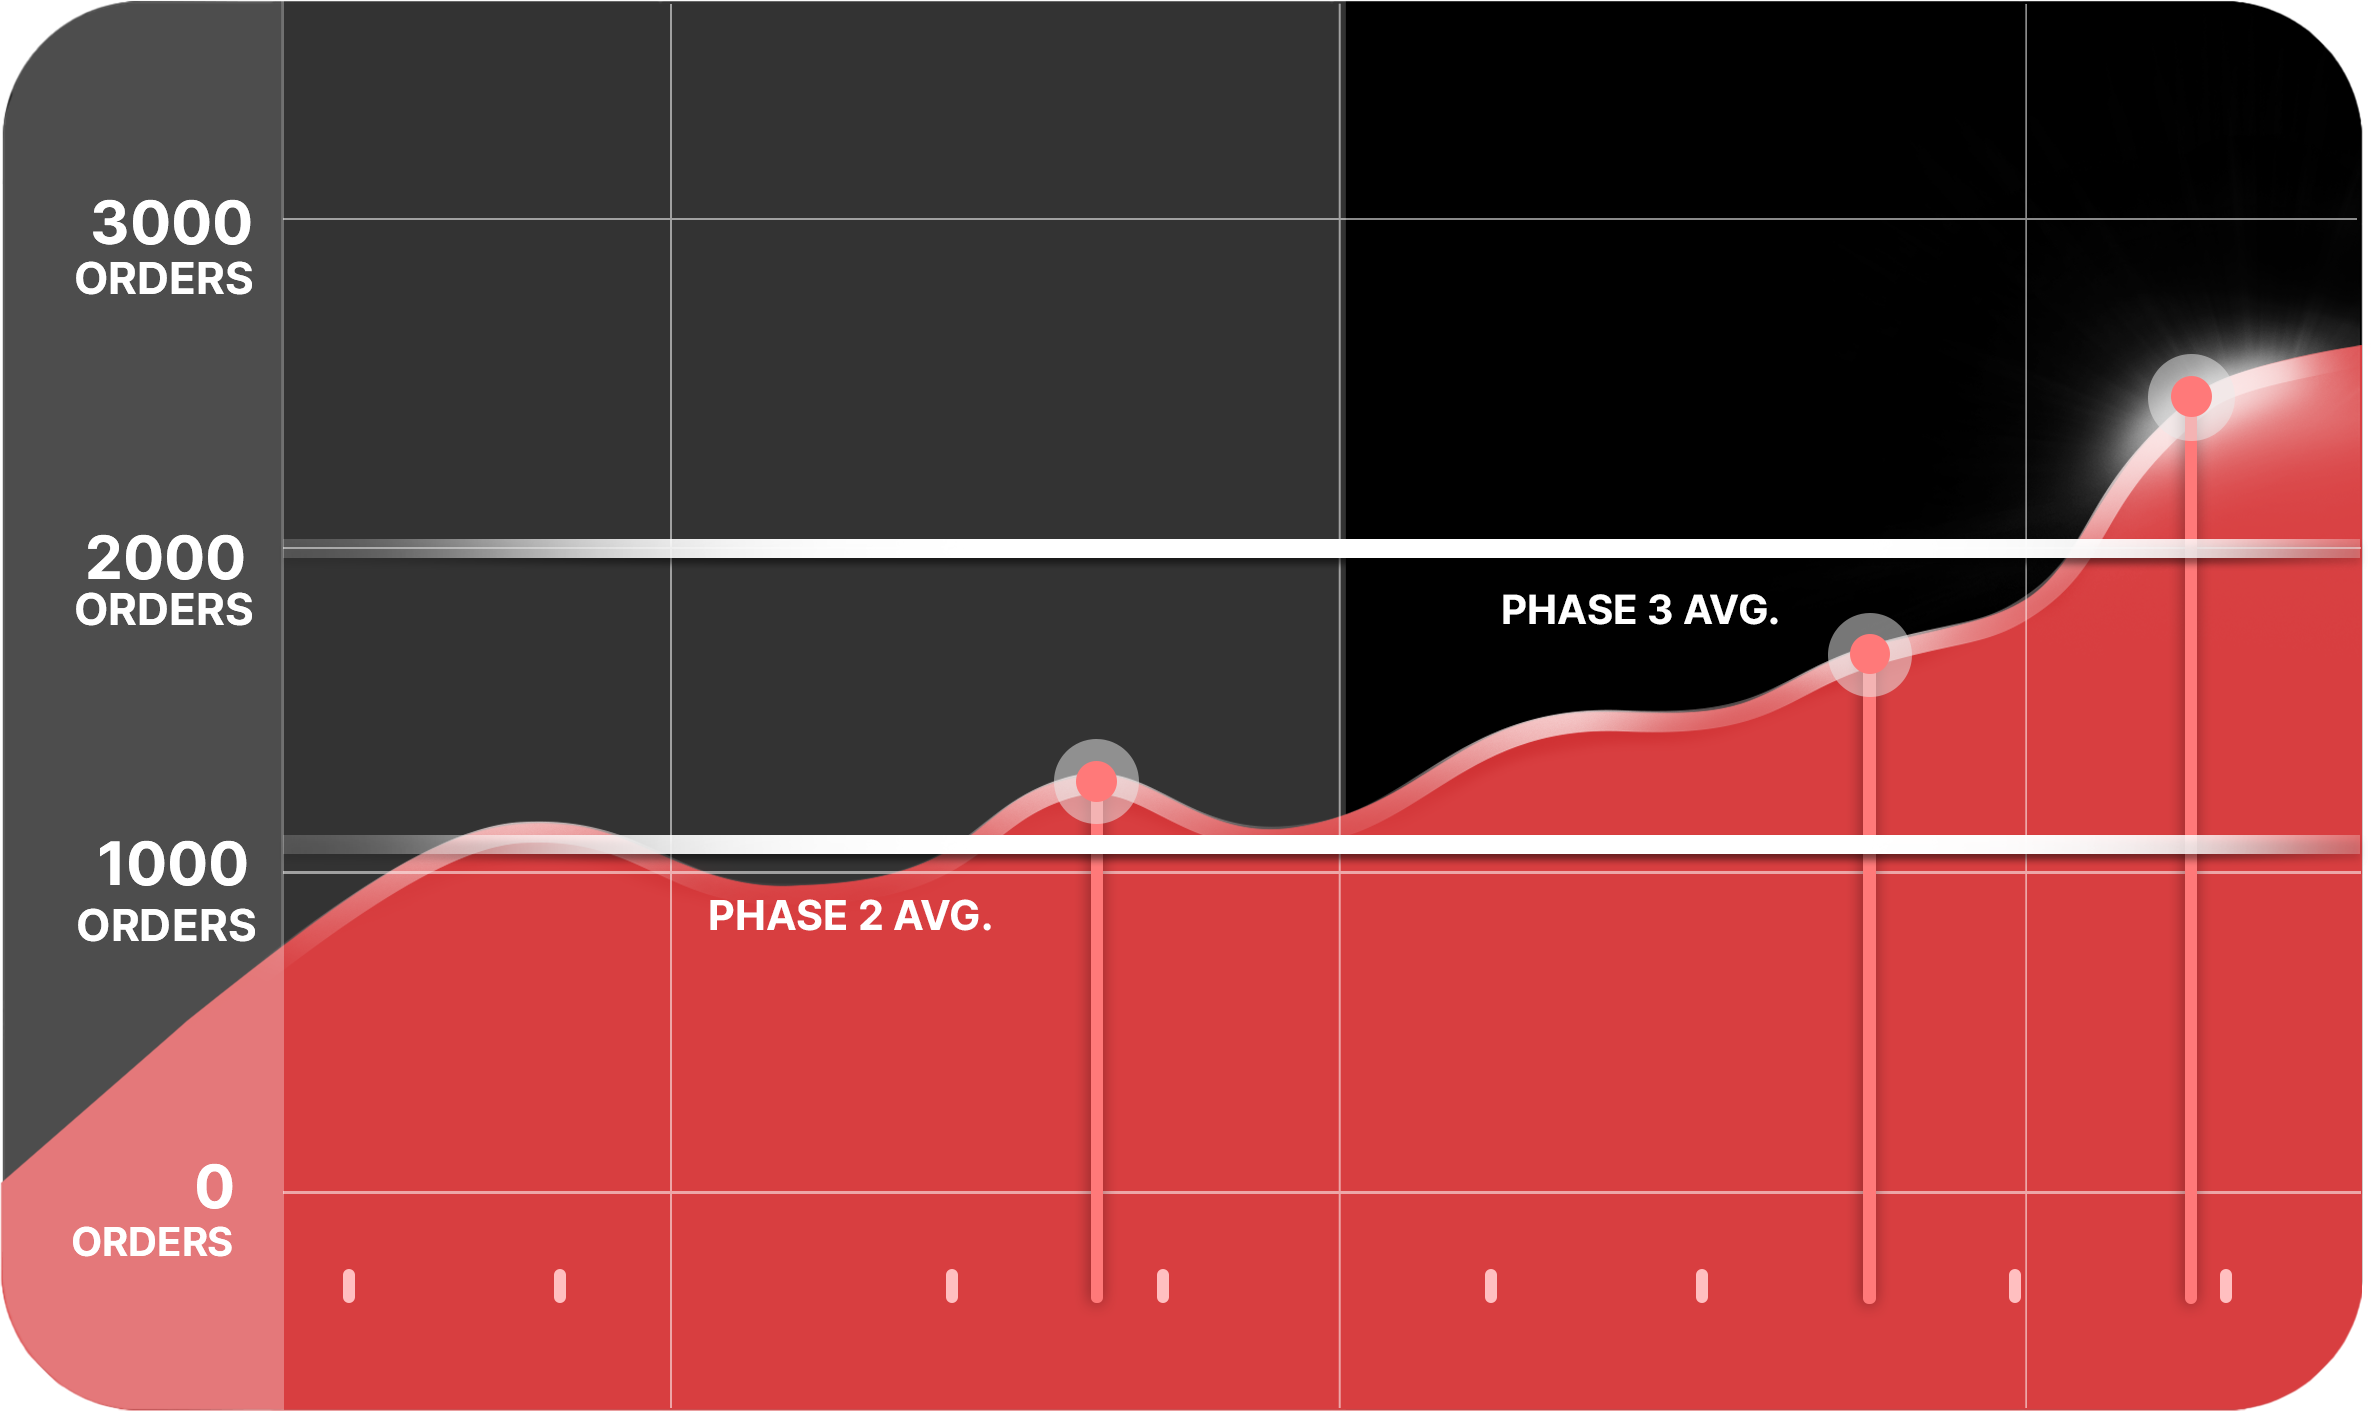
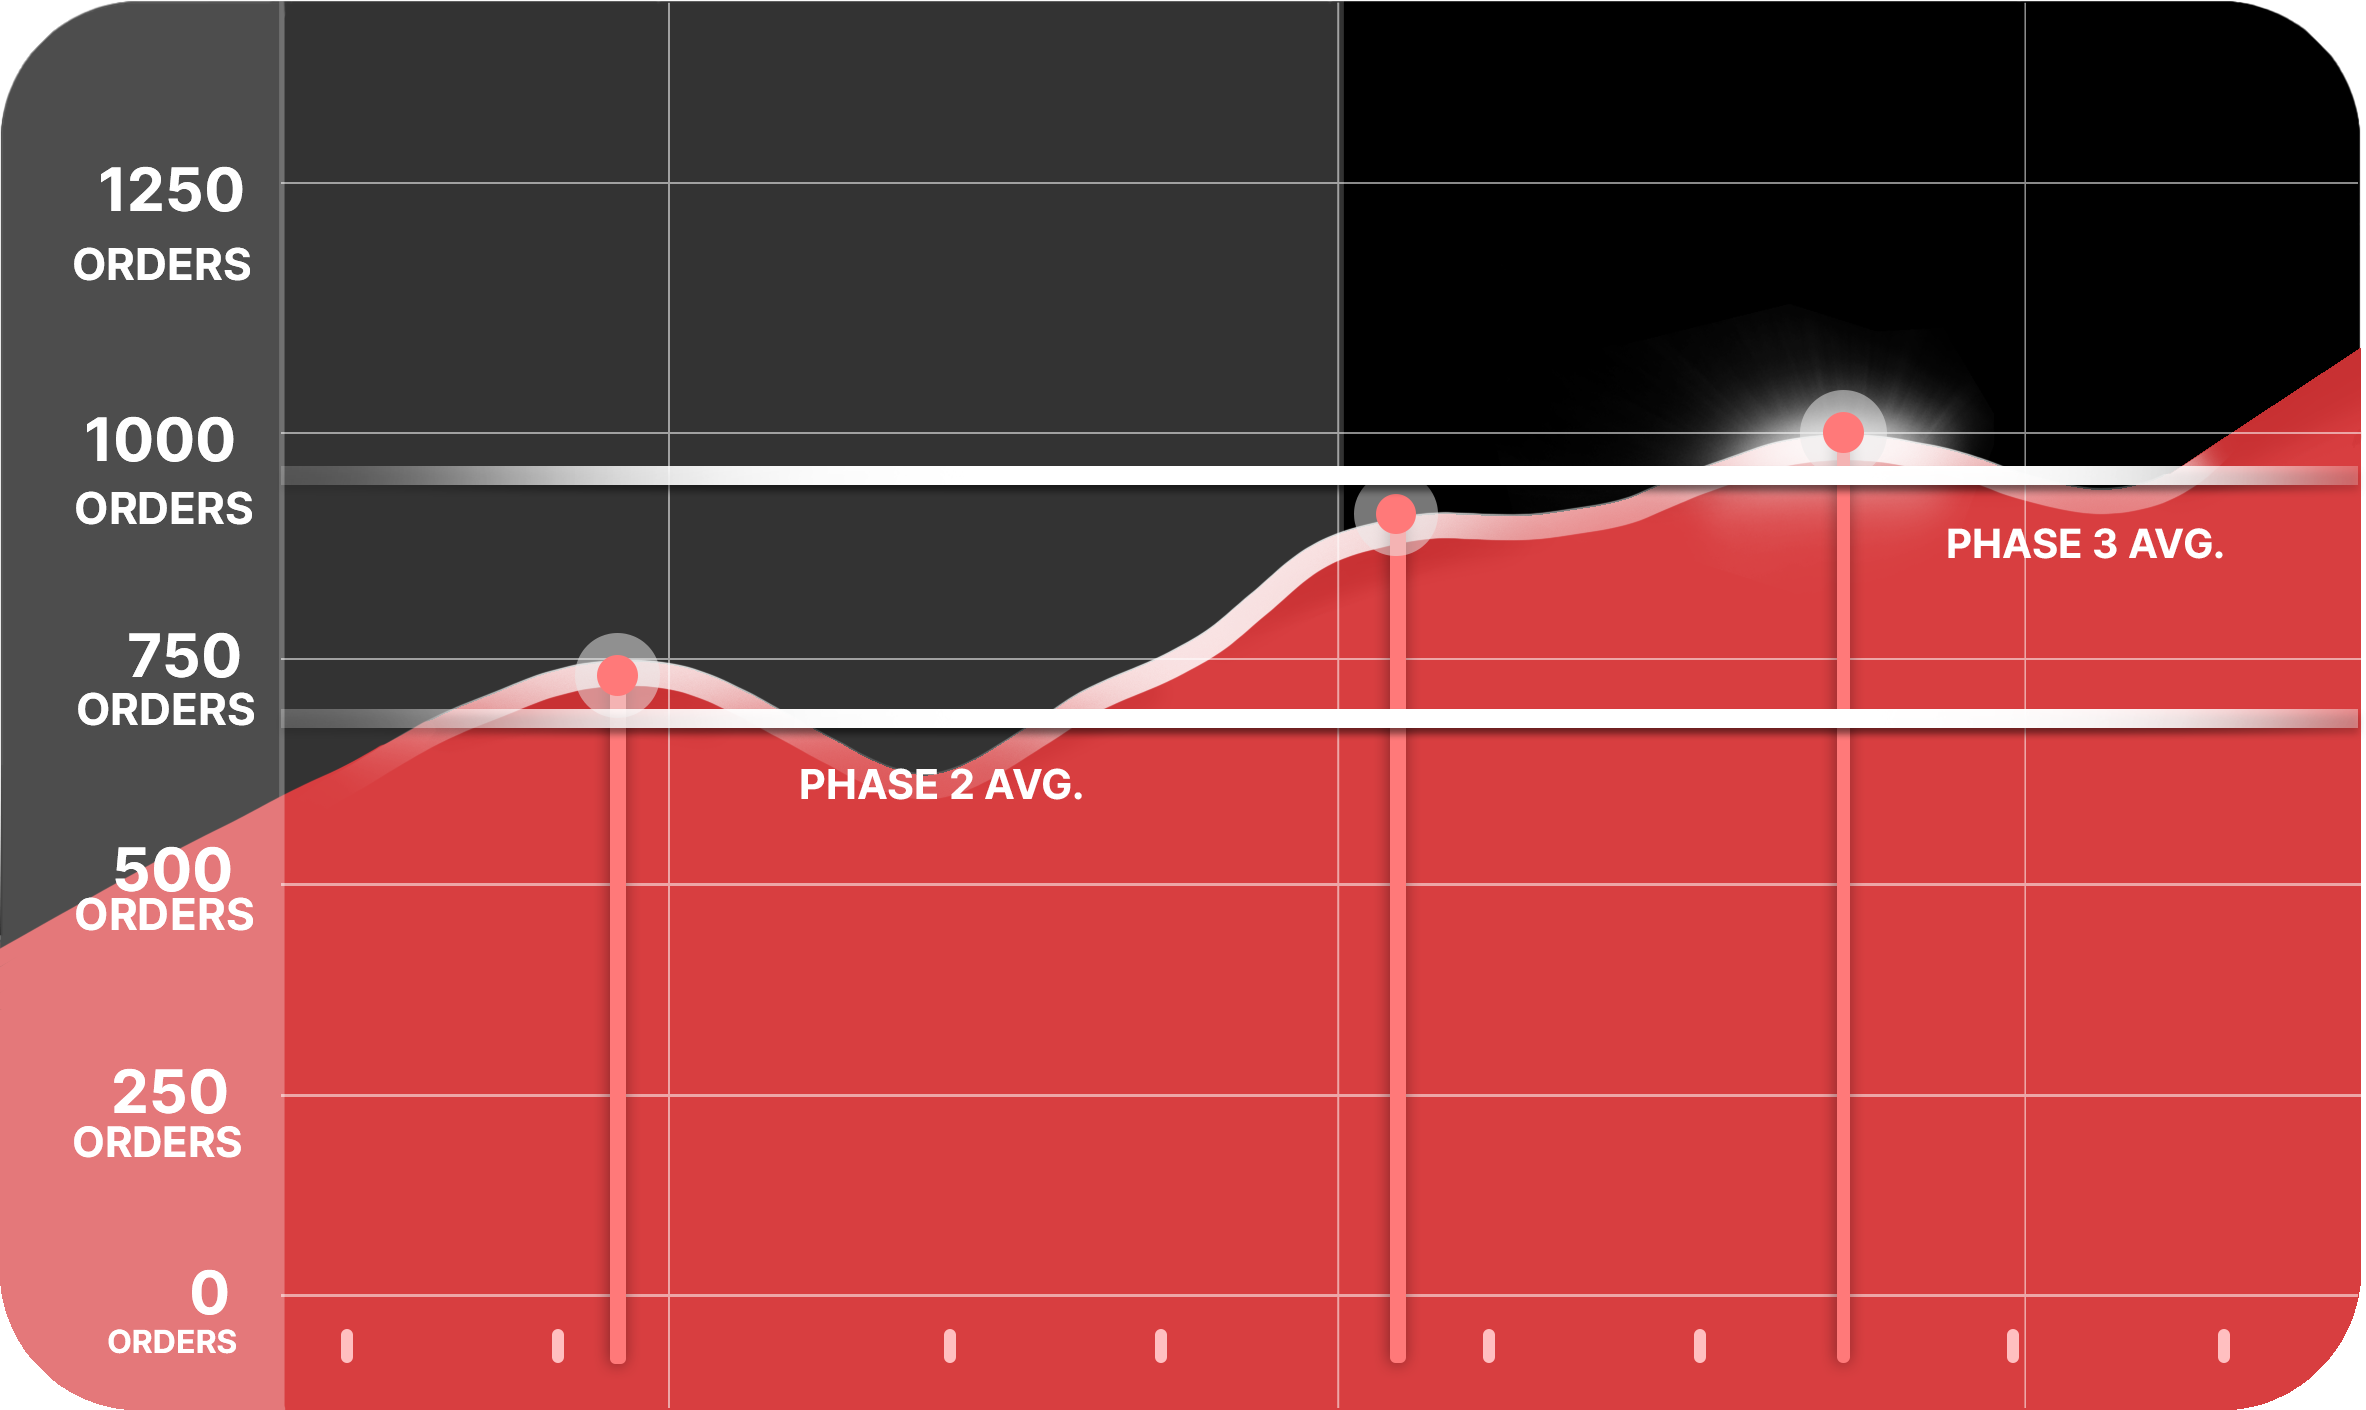
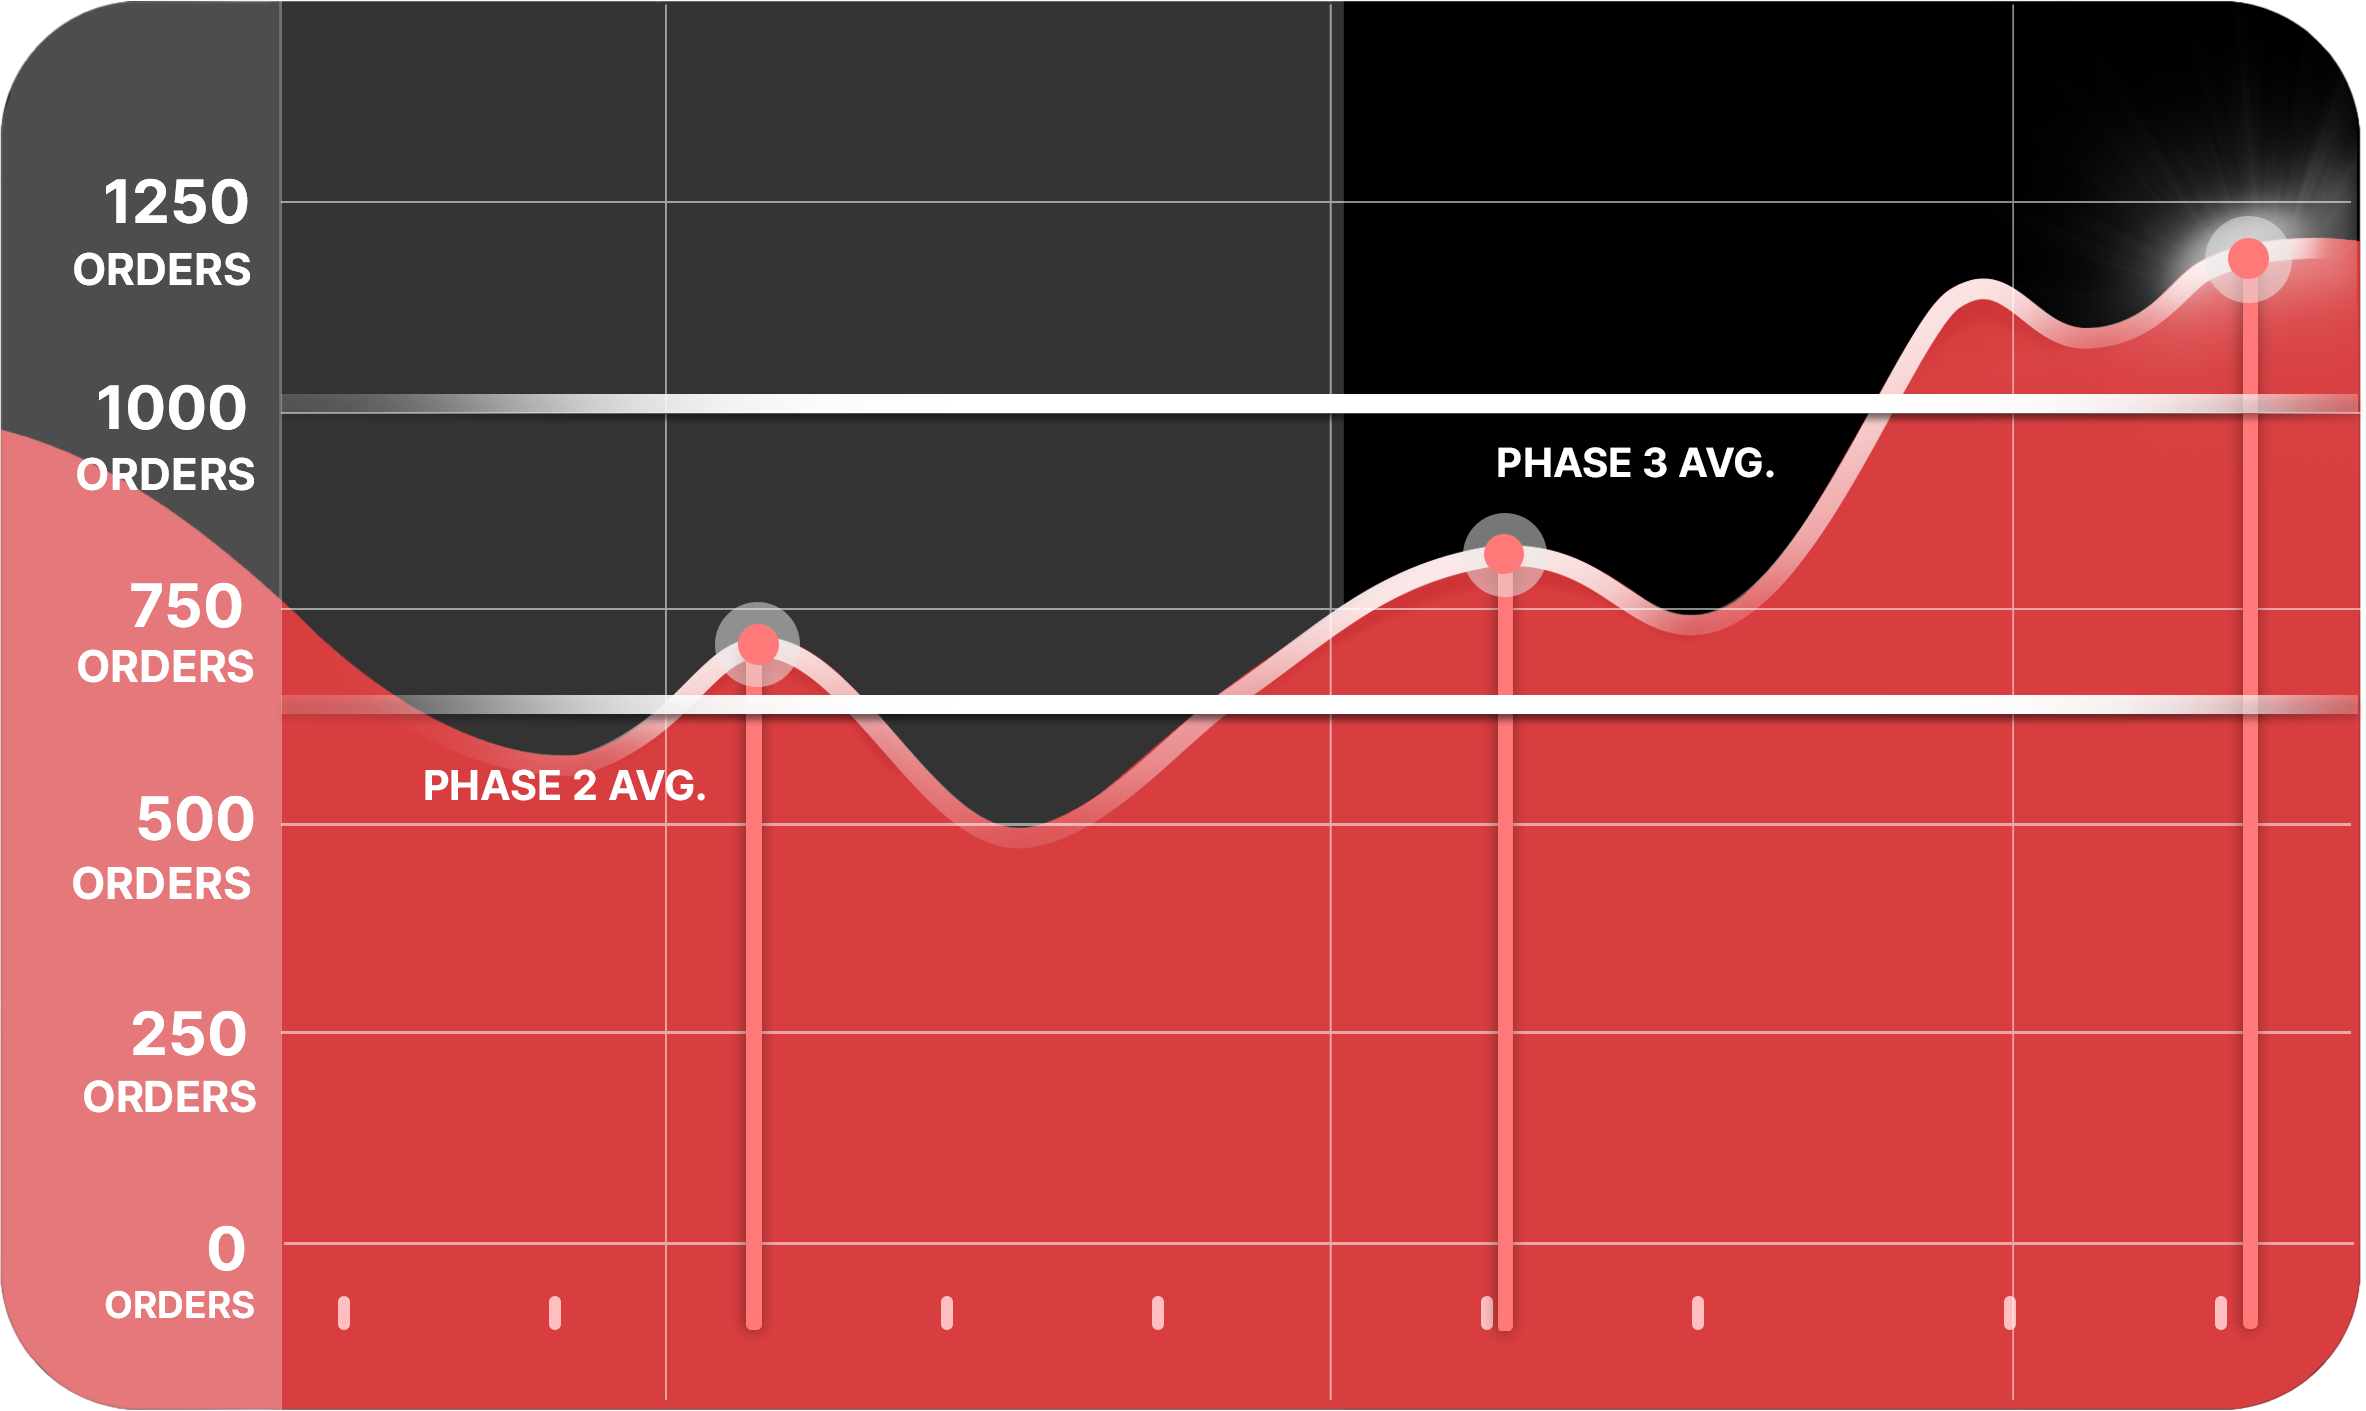
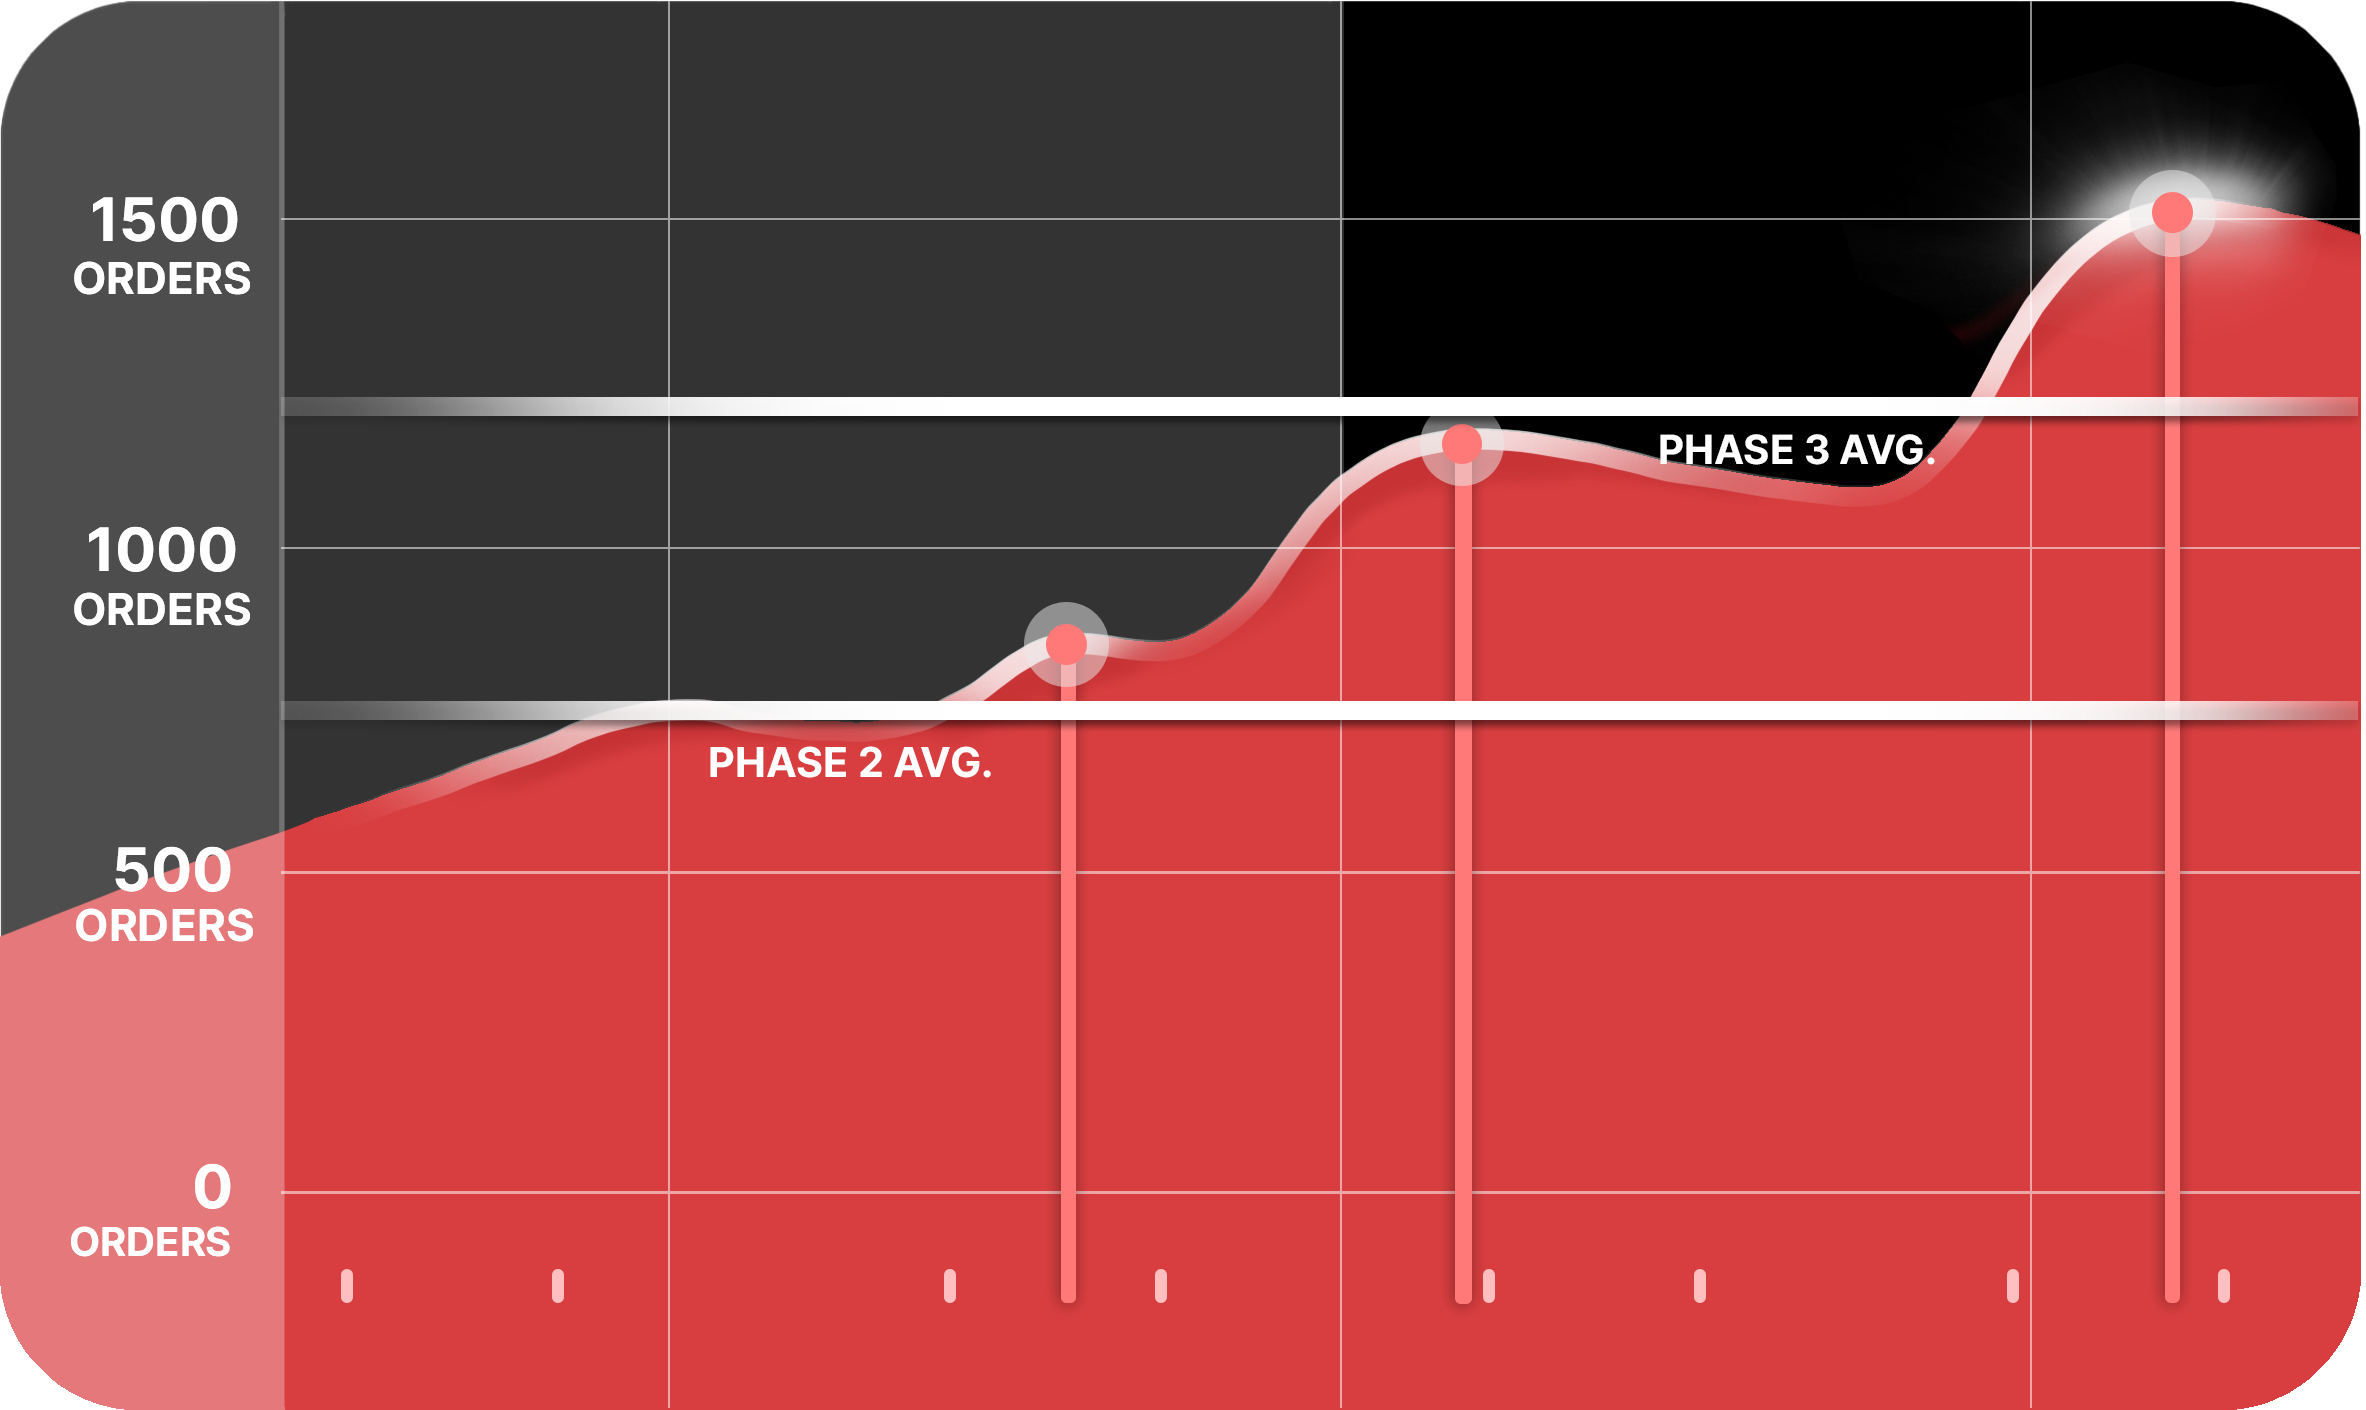
This chart shows the average order count (y-axis) of our beta users transitioning from Phase 2 to Phase 3 on the Amazon® sales channels. Data was collected over 6 to 12 (x-axis) months, with quarterly assessments. Phase 2 and 3 do not depict Phase 1 performance as it can vary. The chart displays mean order quantities for both phases, with peak market observations as bullet points. Please note that this chart is not a sales forecasting tool for Why Unified® and does not guarantee future outcomes. Prudent interpretation is advised.

This chart shows the average order count (y-axis) of our beta users transitioning from Phase 2 to Phase 3 on the Walmart® sales channels. Data was collected over 6 to 12 (x-axis) months, with quarterly assessments. Phase 2 and 3 do not depict Phase 1 performance as it can vary. The chart displays mean order quantities for both phases, with peak market observations as bullet points. Please note that this chart is not a sales forecasting tool for Why Unified® and does not guarantee future outcomes. Prudent interpretation is advised.

This chart shows the average order count (y-axis) of our beta users transitioning from Phase 2 to Phase 3 on the eBay® sales channels. Data was collected over 6 to 12 (x-axis) months, with quarterly assessments. Phase 2 and 3 do not depict Phase 1 performance as it can vary. The chart displays mean order quantities for both phases, with peak market observations as bullet points. Please note that this chart is not a sales forecasting tool for Why Unified® and does not guarantee future outcomes. Prudent interpretation is advised.

This chart shows the average order count (y-axis) of our beta users transitioning from Phase 2 to Phase 3 on the TikTok® Ads sales channels. Data was collected over 6 to 12 (x-axis) months, with quarterly assessments. Phase 2 and 3 do not depict Phase 1 performance as it can vary. The chart displays mean order quantities for both phases, with peak market observations as bullet points. Please note that this chart is not a sales forecasting tool for Why Unified® and does not guarantee future outcomes. Prudent interpretation is advised.

See why thousands of
dropshippers made the switch.

See how 20,000+ dropshippers used brand name products, 2 day shipping, and marketplaces to become successful.

Play Video
Play Video

Q4 2022

Adam P.

Play Video

Q4 2022

Jamie A.

×
calendar Schedule a demo Get started Schedule a demo Click the button below to have a 1-on-1 demo with our team. calendar Book a meeting
Book a meeting