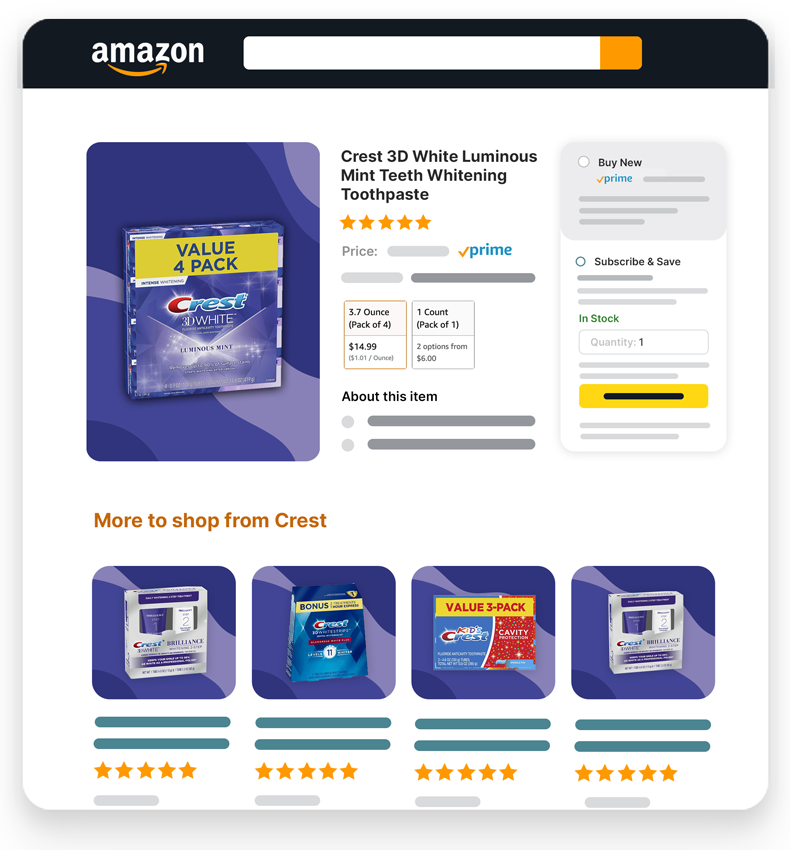
Get predictable results when dropshipping on Prime®
We take the guess work out of dropshipping. Our stores (and products) have been proven to work, and are backed by verified third-party sales estimates so you can have peace of mind.
This chart shows the average order count (y-axis) of our beta users transitioning from Phase 2 to Phase 3 on the Prime® sales channels. Data was collected over 6 to 12 (x-axis) months, with quarterly assessments. Phase 2 and 3 do not depict Phase 1 performance as it can vary. The chart displays mean order quantities for both phases, with peak market observations as bullet points. Please note that this chart is not a sales forecasting tool for Why Unified® and does not guarantee future outcomes. Prudent interpretation is advised.
Facebook® Ads
This chart shows the average order count (y-axis) of our beta users transitioning from Phase 2 to Phase 3 on the Facebook® Ads sales channels. Data was collected over 6 to 12 (x-axis) months, with quarterly assessments. Phase 2 and 3 do not depict Phase 1 performance as it can vary. The chart displays mean order quantities for both phases, with peak market observations as bullet points. Please note that this chart is not a sales forecasting tool for Why Unified® and does not guarantee future outcomes. Prudent interpretation is advised.
Google® Ads
This chart shows the average order count (y-axis) of our beta users transitioning from Phase 2 to Phase 3 on the Google® Ads sales channels. Data was collected over 6 to 12 (x-axis) months, with quarterly assessments. Phase 2 and 3 do not depict Phase 1 performance as it can vary. The chart displays mean order quantities for both phases, with peak market observations as bullet points. Please note that this chart is not a sales forecasting tool for Why Unified® and does not guarantee future outcomes. Prudent interpretation is advised.
Walmart®
This chart shows the average order count (y-axis) of our beta users transitioning from Phase 2 to Phase 3 on the Walmart® sales channels. Data was collected over 6 to 12 (x-axis) months, with quarterly assessments. Phase 2 and 3 do not depict Phase 1 performance as it can vary. The chart displays mean order quantities for both phases, with peak market observations as bullet points. Please note that this chart is not a sales forecasting tool for Why Unified® and does not guarantee future outcomes. Prudent interpretation is advised.
Outcompete dropshippers with branded products.
Get the benefit of selling "gated" products on Prime® that other dropshippers can't sell. That means less competition and more repeat orders for your store!